From Newsgroup: uk.sci.weather
For each of these graphical monthly outputs, I do a scale-matched blink comparison for any changes in the earlier data.
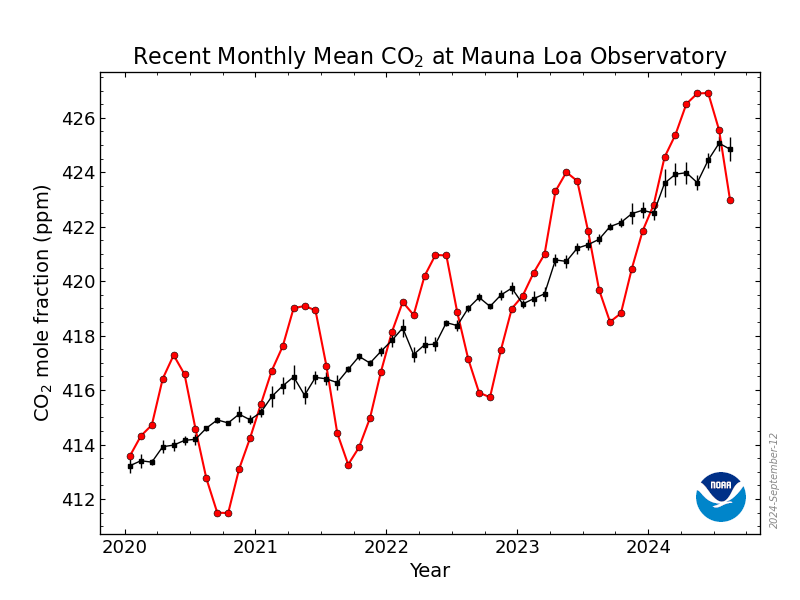
For Mauna Loa data output December 2025 at
https://gml.noaa.gov/webdata/ccgg/trends/co2_trend_mlo.png
and the earlier tabulated data
Using the off-line javascript curve-fitter at statpages.info
Of curve types , linear=no acceleration, exponential=increasing
acceleration, quadratic=fixed acceleration, indicial= falling
acceleration; indicial was best fit by R^2 factor again, but only very marginally over the quadratic and exponential forms.
then adding yearly sine component,
y= a + b*x^c + d*sin(e*x+f)*(1+g*x)
where x is year minus 2000 for data subset start year of 2003 to
avoid the decade of post-Pinatubo geodata recovery, 6
figures retained for anyone else repeating/checking this exercise (bear
in mind the graphical most recent data )
For Dec 2025 output
a= 371.380548
b= 1.041241
c= 1.228251
d= 3.007519
e= 6.263416
f= 6.424214
g= -0.002194
previous history for the sine form of indicial curve type, ignoring the
annual sine component here
To 2050 ,for Dec 2025 output= 498.530 ppm (+0.121ppm)
To 2050 ,for Nov 2025 output= 498.408 ppm (-2.863ppm)
Oct output not processed
To 2050 ,for Sep 2025 output= 501.271 ppm (+3.21ppm)
Aug output not processed
To 2050 ,for Jul 2025 output= 498.062 ppm ( +0.37ppm )
To 2050 ,for Jun 2025 output= 497.690 ppm (+0.39 ppm)
To 2050 ,for May 2025 output= 497.300 ppm ( -0.2 ppm)
For mar and apr outputs, not processed
To 2050 ,for Feb 2025 output= 497.501 ppm ( +0.08 ppm)
To 2050 ,for Jan 2025 output= 497.425 ppm ( +0.19 ppm)
To 2050 ,for Dec 2024 output= 497.239 ppm ( +0.18 ppm)
To 2050 ,for Nov 2024 output= 497.062 ppm ( +0.05 ppm)
To 2050 ,for Oct 2024 output= 497.016 ppm ( -0.03 ppm)
To 2050 ,for Sep 2024 output= 497.046 ppm ( +0.07 ppm)
To 2050 ,for Aug 2024 output= 496.976 ppm ( +0.44 ppm)
To 2050 ,for Jul 2024 output= 496.533 ppm ( +0.51 ppm)
To 2050 ,for Jun 2024 output= 496.020 ppm ( +0.28 ppm)
To 2050 ,for May 2024 output= 495.737 ppm ( +0.09 ppm)
To 2050 ,for Apr 2024 output= 495.646 ppm ( -0.18 ppm)
To 2050 ,for Mar 2024 output= 495.827 ppm ( -0.15 ppm)
To 2050 ,for Feb 2024 output= 495.979 ppm ( -0.24 ppm)
To 2050 ,for Jan 2024 output= 496.222 ppm ( -0.05 ppm)
To 2050, for Dec 2023 output= 496.274ppm (-0.01 )
To 2050, for Nov 2023 output= 496.286ppm (-0.20 )
To 2050, for Oct 2023 output= 496.481ppm (-0.24 )
To 2050, for Sep 2023 output= 496.723ppm (-0.26 but partial data
revisionism )
To 2050, for Aug 2023 output= 496.981ppm (+0.35 )
To 2050, for Jul 2023 output= 496.638ppm (+0.46 )
To 2050, for Jun 2023 output= 496.18 ppm ( +0.27 )
To 2050, for May 2023 output =495.91 ppm (-0.10)
To 2050, for Apr 2023 output =496.01 ppm (-0.80)
To 2050, for Mar 2023 output =496.81 ppm (-0.79)
To 2050, for Feb 2023 output =497.60 ppm (-0.67)
To 2050, for Jan 2023 output =498.27 ppm (-0.28)
To 2050, for Dec 2022 output =498.55 ppm (-0.27)
To 2050, for Nov output =498.82 ppm ( -0.49)
To 2050 ,for Oct output=499.31 ppm (-0.32)
To 2050 ,for Sept output=499.63 ppm (-0.04)
To 2050 , for August output= 499.67 ppm (+0.20)
July 2022 output data , to 2050 , 499.47 ppm (+0.04)
June 2022 output data , to 2050 , 498.43 ppm (+0.15)
May 2022 output To 2050 , 498.28 ppm (-0.39)
April output to 2050, 498.67 ppm (-0.83)
March output to 2050, 499.5 ppm (-0.20)
Feb output was 499.7 (-15.55)
Jan 2022 output was 515.25
--
Global sea level rise to 2100 from curve-fitted existing altimetry data <
http://diverse.4mg.com/slr.htm>
--- Synchronet 3.21a-Linux NewsLink 1.2