From Newsgroup: sci.misc
From the -2ashes ashes we all fall down-+ department:
Feed: Hackaday
Title: How Bad Is That Bridge: A Government Database
Author: Zoe Skyforest
Date: Tue, 27 Oct 2026 14:40:49 +0000
Link:
https://hackaday.com/2026/10/27/how-bad-is-that-bridge-a-government-database/
Podcast Download URL:
https://hackaday.com/wp-content/uploads/2026/10/Screenshot-2026-10-23-133838.png?w=400
[image 1 (link #1)]
Bridges! We kind of expect them to just be there and do their job, ad infinitum. They are built into the landscape, and we often take them and
the routes they open up for granted.
The reality, as any civil engineer will tell you, is that bridges are
living, breathing things that require endless maintenance and monitoring
to keep them safe, standing, and functional. A great example of this is
found in the US Department of Transportation, and its publicly
accessible register of bridge health reports.[2]
Stay Standing
The thing about bridges is that we rely on them. They serve as vital
transport links in our communities, ferrying people to and from work and school, and acting as the very arteries of commerce as trucks and trains
haul goods to and fro. When a bridge crossing has to close, either for maintenance or at end of life, this link is severed, often with serious economic and logistical impacts. For that reason, we tend to like to
keep our bridges in service as long as possible. The result, of course,
is that if pursuing this goal means that proper maintenance and repairs arenrCOt seen to, there is a risk of collapserCowhich often comes with worse consequences. Loss of life is common when bridges fail, and replacing a collapsed bridge is often much harder and more time consuming than
handling things properly ahead of time.
In the United States, itrCOs a well known fact that the bridges are
getting old. The average bridge is 44 years old[3], which is bumping up
against the 50-year service limit many were originally built for. Being
an average number, itrCOs indicative that many bridges are exceeding that figure significantly. Obviously, a bridgerCOs age isnrCOt a perfect proxy
for its condition, but closer examinations indicate thererCOs definitely a problem. A 2024 report from the American Road & Transportation Builders Association noted that 36 percent of US bridges are in need of repair or replacement[4], a total of 221,800 spans. 42,067 spans were considered
to be in rCLpoorrCY condition, which in their total see 168.5 million
motorists crossing them every day. ItrCOs a particularly sobering figure
as it highlights the size of the disaster possible if these structures
are to fail.
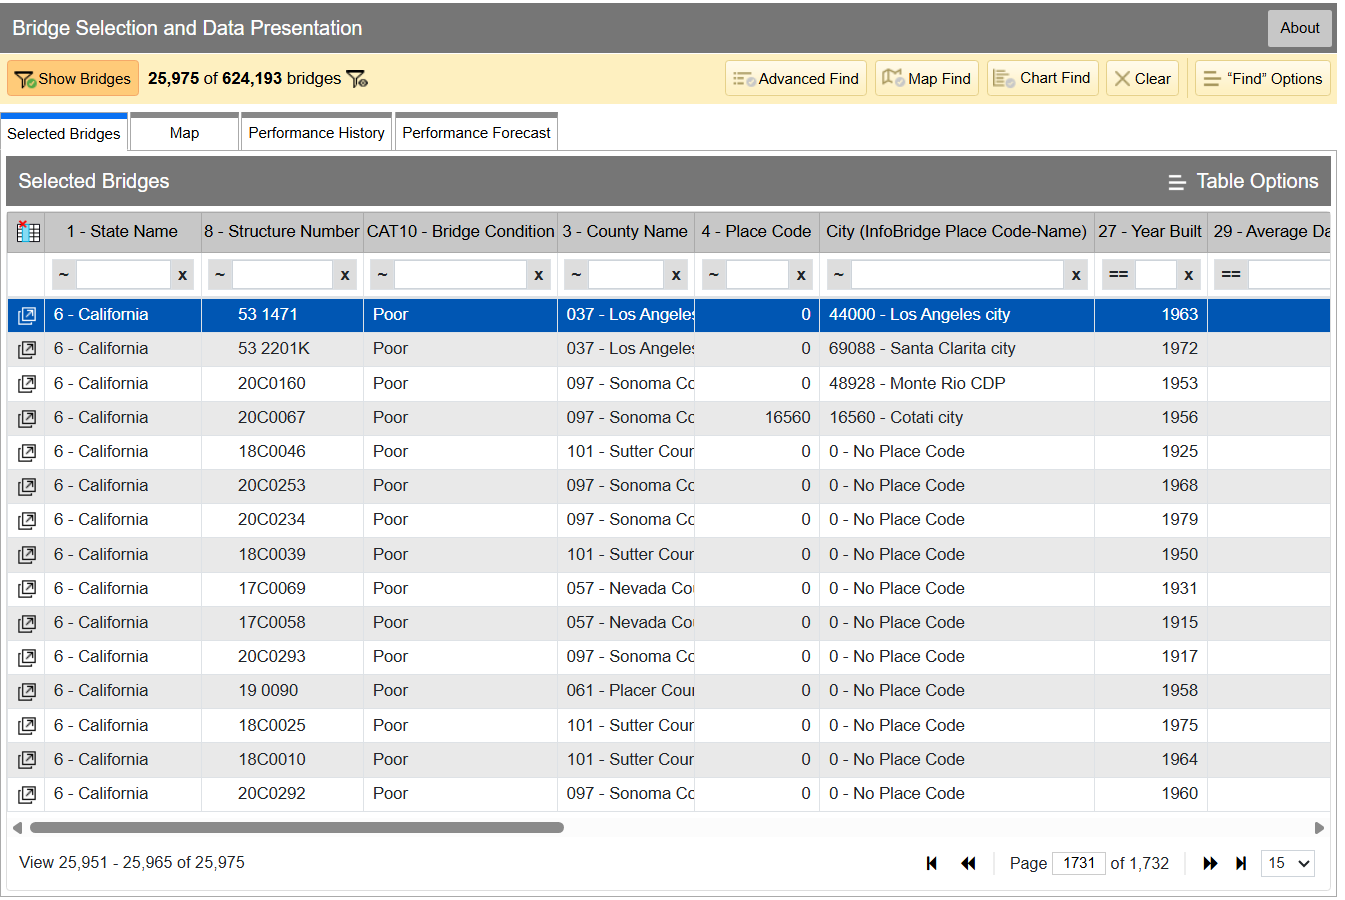
[image 2 (link #6)][5]InfoBridge quickly lets you sort through data by
all kinds of different factors. If yourCOre looking for the worst bridges
in town, itrCOs easy to flick through CAT10 rCo BRIDGE CONDITION to see
which bridges as listed as Good, Fair, or Poor. Bridges are rated on the condition of their deck, superstructure, and substructure, and the
lowest scoring section influences which bin the bridge lands in, as per
federal coderCospecifically, 23 CFR 490 Subpart D[7]. Credit: InfoBridge screenshot
You can drill down into the data yourself if you desire. Within the
Department of Transport, the Federal Highway Administration maintains
LTBP InfoBridge,[8] a database of information on bridges all across the country. It was developed by the Long Term Bridge Performance program,
because the goal of the project is to understand how these structures
hold up and perform over the decades. The database is publicly
accessible, and serves as a portal for all the available data and
statistics on how US bridges are doing. It hopes to enable everyone from
state and federal authorities, to university students, faculty, and
other researchers, to dive into bridge data and visualize and understand
it better.
Data available is from a wide number of sources, including the National
Bridge Inventory and National Bridge Element datasets, as well as
climatic data collected from NASArCOs MERRA-2 database. ThererCOs also construction and design data sourced by the LTBP program, along with non-destructive evaluations that have been carried out. Data from
various other special projects is available too, such as from Federal
Highway Administration projects investigating timber bridges, steel
weathering, and the use of ultra-high performance concrete structures.
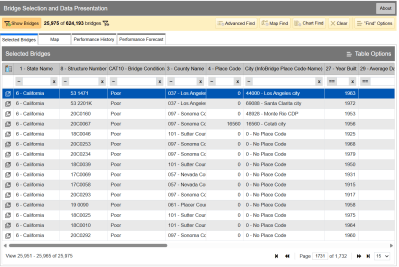
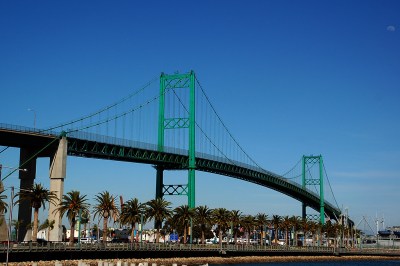
[image 3 (link #10)][9]Just glancing at the Vincent Thomas bridge wonrCOt
tell you how the structure is doing. Credit: The Port of Authority[11],
CC BY-SA 3.0
If you have a particular bridge of interest, itrCOs easy to get a quick
break down of how itrCOs doing. For example, you might like to know about
the Vincent Thomas Bridge, in Los Angeles, California: National Bridge Inventory number 53 1471. It links San Pedro with Terminal Island, and
is a suspension bridge with a total length of 6,060 feet and a longest
span of 1,500 feet. Built in 1963, we can see from the data alone that
itrCOs now showing its age.
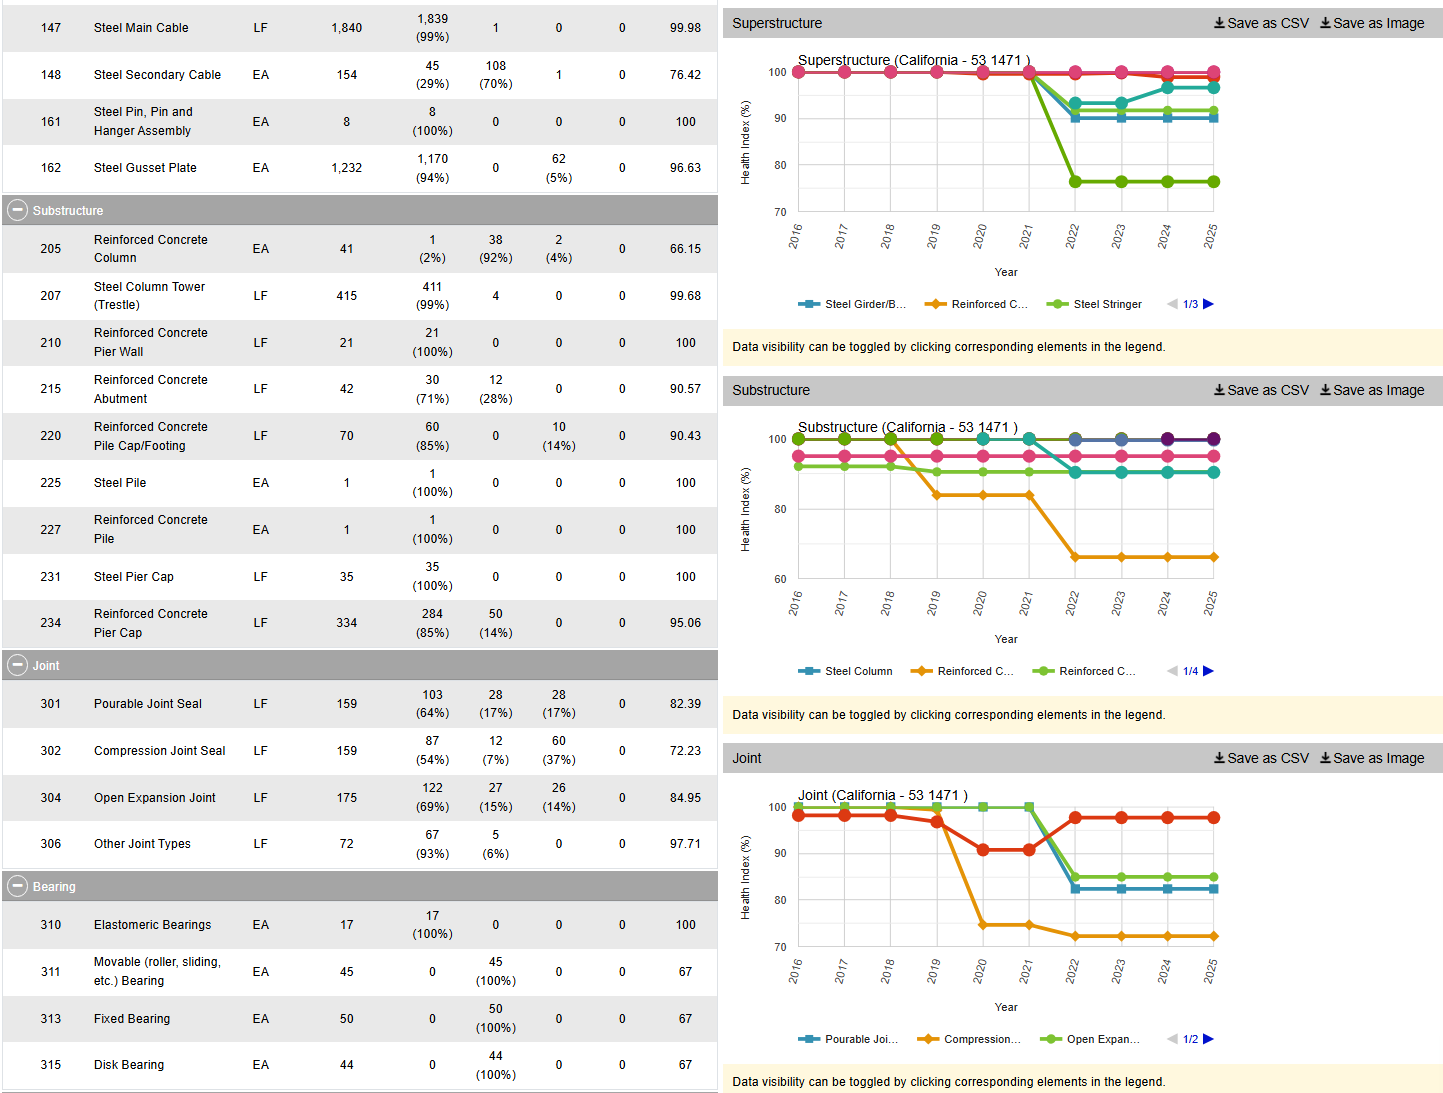
The bridge condition is listed as rCLPoor,rCY and if we dive deeper into the National Bridge Elements data, we can see why. The health indexes of the
deck, substructure, and superstructure have all been trending down in
recent years as the bridgerCOs age has increased, with a particular drop
off from 2019 or so. In particular, the steel cables and girders on the
bridge have been showing their age, and the concrete columns supporting
the bridge have been similarly degrading. The deck, too, is in need of
repair, with the California Department of Transport recently dedicating
some $706 million to replace it ahead of the 2028 Olympic Games.
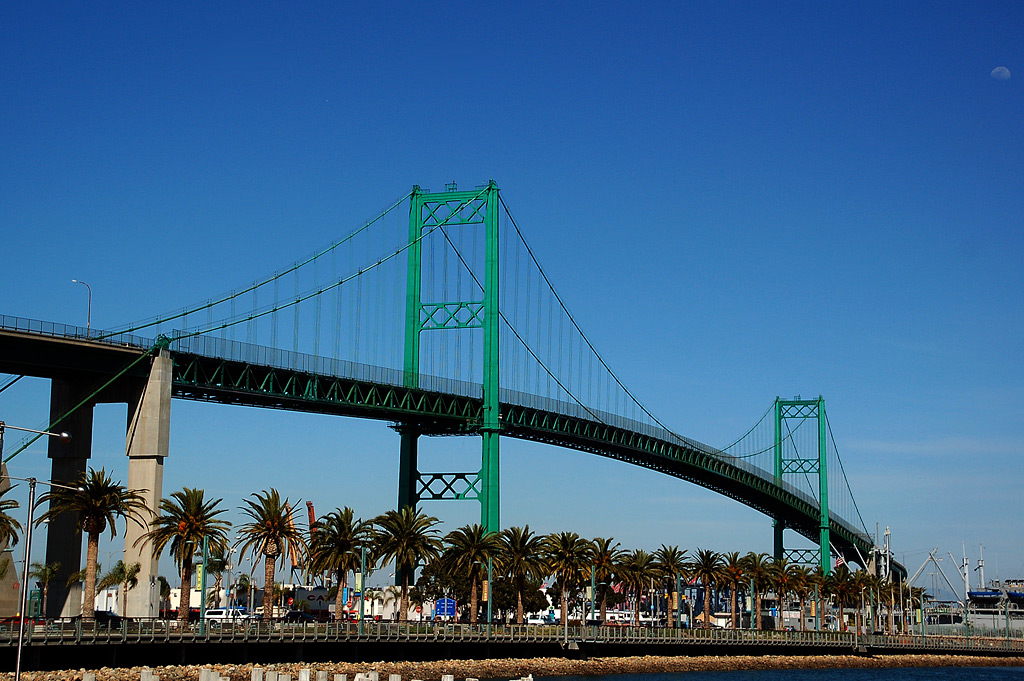
[image 4 (link #13)][12]However, InfoBridge will let you drill down into detailed reports on the bridge conditions, down to a level which
indicates which parts of the bridge are most in need of maintenance,
repair, or replacement. Credit: Screenshot, InfoBridge
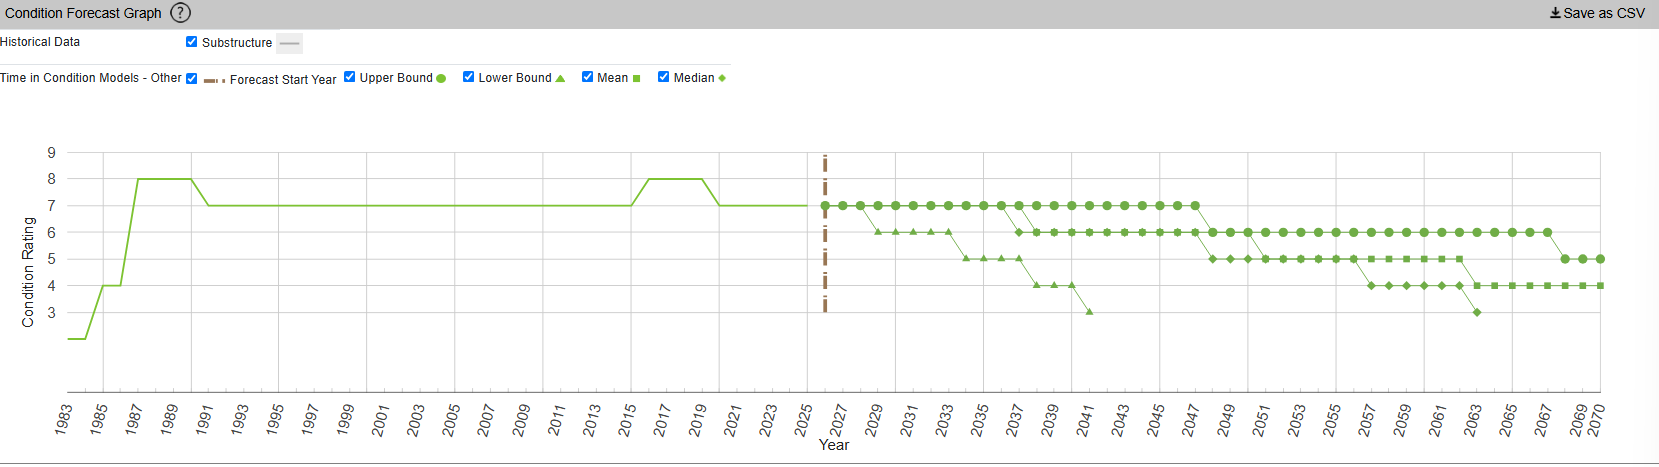
InfoBridge also offers condition forecasts for many bridges across the
country. For example, the 24th Street Bridge over Rio Linda Creek is
currently listed as being in rCLGoodrCY condition. Current forecasts show
that the deck and superstructure is expected to be in much poorer shape somewhere between 2035 and 2055, while the substructure is expected to
hang on in good shape for a bit longer.
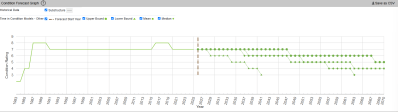
[image 5 (link #15)][14]The Long Term Bridge Performance Program has
developed a variety of modelsrCobase, survival, and machine-learningrCoto predict bridge condition over time. The aim is to guide maintenance
efforts over time and allow for better planning. Credit: InfoBridge,
screenshot
You might think that yourCOd have to query a government department and
delve deep into some dusty records room to learn about the condition of
your local bridges. Instead, thanks to the efforts of diligent civil
servants, you can instead access all the rich inspection data you like
from the comfort of your own web browser. ItrCOs not just good for citizen oversight, either. It aids local authorities and bridge owners in making
the right decisions, by putting the necessary data right at their
fingertips.
It also creates a certain level of accountabilityrCohaving the data
available means thererCOs little room for anyone to make excuses that they
were unaware of a bridgerCOs condition prior to something going wrong. Ultimately, itrCOs just one arm of a project that hopes to take US bridges safely long into the future.
Featured image: rCLBrooklyn Bridge rCo New York City[16]rCY by [Simone Roda]
Links:
[1]:
https://hackaday.com/wp-content/uploads/2026/10/Brooklyn_Bridge_-_New_York_City_featured.png?w=800 (image)
[2]:
https://infobridge.fhwa.dot.gov/data/DashboardForecast (link)
[3]:
https://mainstreet.getbeyondx.com/articles/2026-04-19-why-your-commute-is-getting-longer-america-s-aging-bridges-are-falling-behind/ (link)
[4]:
https://artbabridgereport.org/reports/2024-ARTBA-Bridge-Report.pdf (link) [5]:
https://hackaday.com/wp-content/uploads/2026/10/Screenshot-2026-10-23-132108.png (link)
[6]:
https://hackaday.com/wp-content/uploads/2026/10/Screenshot-2026-10-23-132108.png?w=400 (image)
[7]:
https://www.ecfr.gov/current/title-23/chapter-I/subchapter-E/part-490/subpart-D/section-490.409 (link)
[8]:
https://infobridge.fhwa.dot.gov/Home (link)
[9]:
https://hackaday.com/wp-content/uploads/2026/10/Vincent_Thomas_Bridge_2.jpg (link)
[10]:
https://hackaday.com/wp-content/uploads/2026/10/Vincent_Thomas_Bridge_2.jpg?w=400 (image)
[11]:
https://en.wikipedia.org/wiki/File:Vincent_Thomas_Bridge_2.jpg#/media/File:Vincent_Thomas_Bridge_2.jpg (link)
[12]:
https://hackaday.com/wp-content/uploads/2026/10/Screenshot-2026-10-23-133318.png (link)
[13]:
https://hackaday.com/wp-content/uploads/2026/10/Screenshot-2026-10-23-133318.png?w=400 (image)
[14]:
https://hackaday.com/wp-content/uploads/2026/10/Screenshot-2026-10-23-133838.png (link)
[15]:
https://hackaday.com/wp-content/uploads/2026/10/Screenshot-2026-10-23-133838.png?w=400 (image)
[16]:
https://commons.wikimedia.org/wiki/File:Brooklyn_Bridge_-_New_York_City.jpg (link)
--- Synchronet 3.22a-Linux NewsLink 1.2