Le 17/12/2025 a 19:34, Mitchell Holman a ocrita:
Climate change deniers, lunar landing deniers,
evolution deniers, anti-vaxxers, flat earthers,
they all use the same rhetoric and thus all sound
alike.
Even data speak the same language : temperature variations precede
carbon dioxide variations in instrumental records.
https://www.woodfortrees.org/plot/crutem4vgl/derivative/mean:12/mean:14/from:1958/normalise/plot/esrl-co2/derivative/mean:12/mean:14/scale:20/detrend:3/from:1958/normalise
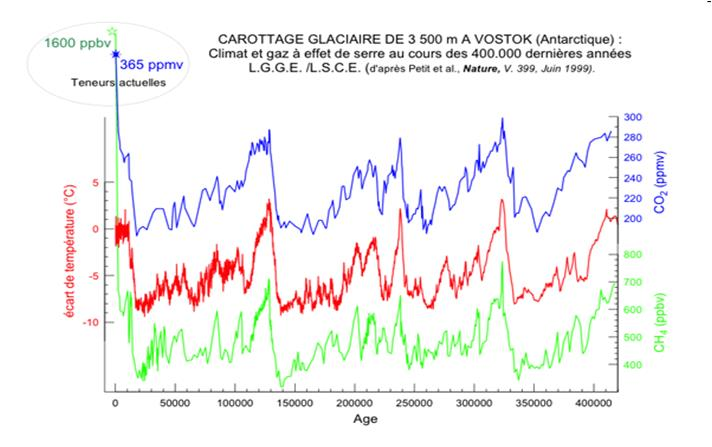
And it precedes in geological (proxy) records by ~800 years too !
What other effect do you know which comes before its supposed cause ?
Weird isn't it ?
And it precedes in geological (proxy) records by ~800 years too !Apparently it's part of a feedback loop:
What other effect do you know which comes before its supposed cause ?
Weird isn't it ?
Le 24/02/2026 a 16:54, Vincent Maycock a ocrita:
And it precedes in geological (proxy) records by ~800 years too !Apparently it's part of a feedback loop:
What other effect do you know which comes before its supposed cause ?
Weird isn't it ?
But CO2 variations follow temperature variations at all time scales (in >observations).
A cause never follows its consequence.
On Tue, 24 Feb 2026 17:02:14 +0100, Paul Aubrin
<paul.aubrin@invalid.org> wrote:
Le 24/02/2026 |a 16:54, Vincent Maycock a |-crit-a:
And it precedes in geological (proxy) records by ~800 years too !Apparently it's part of a feedback loop:
What other effect do you know which comes before its supposed cause ?
Weird isn't it ?
But CO2 variations follow temperature variations at all time scales (in
observations).
A cause never follows its consequence.
From the site you snipped:
https://skepticalscience.com/co2-lags-temperature-intermediate.htm
Le 24/02/2026 a 18:10, Vincent Maycock a ocrita:
On Tue, 24 Feb 2026 17:02:14 +0100, Paul Aubrin
<paul.aubrin@invalid.org> wrote:
Le 24/02/2026 a 16:54, Vincent Maycock a ocrita:
And it precedes in geological (proxy) records by ~800 years too !Apparently it's part of a feedback loop:
What other effect do you know which comes before its supposed cause ? >>>>> Weird isn't it ?
But CO2 variations follow temperature variations at all time scales (in
observations).
A cause never follows its consequence.
From the site you snipped:
Observations show that CO2 concentration variations follow temperature >variations, not the other way.
https://skepticalscience.com/co2-lags-temperature-intermediate.htm
Even if a Scientific Authority as prestigious as "Skeptical Science"
says it, if is not what is observed in reality, I won't trust them.
A question (please answer it honestly) which curve variations peak
first, the red one or the green one ?
https://www.woodfortrees.org/plot/gistemp/derivative/mean:12/mean:14/from:1958/normalise/plot/esrl-co2/derivative/mean:12/mean:14/scale:20/detrend:3/from:1958/normalise
[ ] the red curve
[ ] the green curve
Red : GISStemp variations
Green : Mauna Loa CO2 ppm variations
https://www.woodfortrees.org/plot/gistemp/derivative/mean:12/mean:14/
from:1958/normalise/plot/esrl-co2/derivative/mean:12/mean:14/scale:20/
detrend:3/from:1958/normalise
[ ] the red curve
[ ] the green curve
Red : GISStemp variations
Green : Mauna Loa CO2 ppm variations
Even if a Scientific Authority as prestigious as do-it-yourself
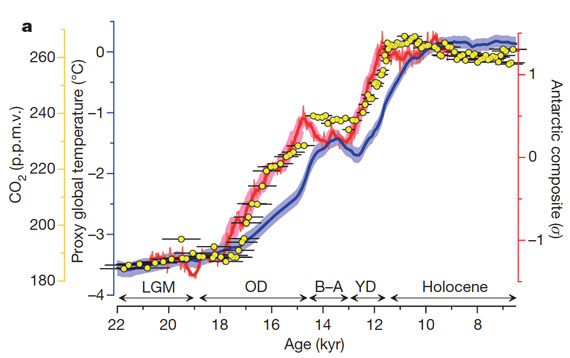
90% of global warming in past ice ages
followed CO2 increases
Le 25/02/2026 a 18:12, Vincent Maycock a ocrita:
https://www.woodfortrees.org/plot/gistemp/derivative/mean:12/mean:14/
from:1958/normalise/plot/esrl-co2/derivative/mean:12/mean:14/scale:20/
detrend:3/from:1958/normalise
[ ] the red curve
[ ] the green curve
Red : GISStemp variations
Green : Mauna Loa CO2 ppm variations
Even if a Scientific Authority as prestigious as do-it-yourself
This is data : variation rate of global GISS temperatures and variation >rates of carbon dioxide concentration published by the Mauna Loa >observatory. Which curve peaks precede the other curve peaks, the red
one or the green one ?
Le 25/02/2026 a 18:12, Vincent Maycock a ocrita:
90% of global warming in past ice ages
followed CO2 increases
No, it is absolutely false. On a geological scale, carbon dioxide >concentration variations follow (proxy) temperature variations by 800 or >1000 years.
Le 24/02/2026 a 18:10, Vincent Maycock a ocrita:
On Tue, 24 Feb 2026 17:02:14 +0100, Paul Aubrin
<paul.aubrin@invalid.org> wrote:
Le 24/02/2026 a 16:54, Vincent Maycock a ocrita:
And it precedes in geological (proxy) records by ~800 years too !Apparently it's part of a feedback loop:
What other effect do you know which comes before its supposed cause ? >>>> Weird isn't it ?
But CO2 variations follow temperature variations at all time scales (in
observations).
A cause never follows its consequence.
From the site you snipped:
Observations show that CO2 concentration variations follow temperature variations, not the other way.
https://skepticalscience.com/co2-lags-temperature-intermediate.htm
Even if a Scientific Authority as prestigious as "Skeptical Science"
says it, if is not what is observed in reality, I won't trust them.
A question (please answer it honestly) which curve variations peak
first, the red one or the green one ?
https://www.woodfortrees.org/plot/gistemp/derivative/mean:12/mean:14/from:1958/normalise/plot/esrl-co2/derivative/mean:12/mean:14/scale:20/detrend:3/from:1958/normalise
[ ] the red curve--- Synchronet 3.21b-Linux NewsLink 1.2
[ ] the green curve
Red : GISStemp variations
Green : Mauna Loa CO2 ppm variations
This is data : variation rate of global GISS temperatures and variationAre you sure the Mauna Loa observatory is representative, to begin
rates of carbon dioxide concentration published by the Mauna Loa
observatory. Which curve peaks precede the other curve peaks, the red
one or the green one ?
with at least, of global changes in CO2 levels?
What if initial anthropogenic warming was too small to show up in the atmospheric CO2 (perhaps due to the high solubility of CO2 in water
compared to land) levels until it was released into the atmosphere
from the oceans, making it look like temperature was causing the CO2
levels to increase?
https://www.woodfortrees.org/plot/gistemp/derivative/mean:12/mean:14/
from:1958/normalise/plot/esrl-co2/derivative/mean:12/mean:14/scale:20/
detrend:3/from:1958/normalise
The first question that strikes me is, what does this graph mean? Why
are you comparing derivatives, what are the mean(samples) steps, what is "detrending" and why is #2 detrended and #1 is not, and what filters did
you use?
Le 26/02/2026 a 06:32, Samuel Spade a ocrita:
https://www.woodfortrees.org/plot/gistemp/derivative/mean:12/mean:14/
from:1958/normalise/plot/esrl-co2/derivative/mean:12/mean:14/scale:20/
detrend:3/from:1958/normalise
The first question that strikes me is, what does this graph mean? Why
are you comparing derivatives, what are the mean(samples) steps, what is "detrending" and why is #2 detrended and #1 is not, and what filters did you use?
You do realize that restricting data to derivatives is itself a
high-pass filter? Would "detrending" be another HPF? What low-pass filtering did you use, is it just a crude Simple Moving Average? Is
there an overall transfer function for the process? What was the unfiltered spectral content before manipulating, and what steps did you take to avoid aliasing?
What effect does this processing have on phase distortion? The phase relationship between temp and CO2 is, after all, what you are hanging
your causal hat upon, right?
To answer to all this would plunge us ass-deep into laplace and z-transforms. May I presume you haven't done that?
It's hard to discount the nagging possibility that you just massaged the data until you got what fit your agenda.
Using derivative is a known way to try to correlate two time series with trends (zero frequency component).
The running mean (convolution) is a cheap (but effective) low pass
filter. You can replace it by a fourrier transform, low pass filter,
inverse fourrier transform if you want. The temperature series doesn't
need to be detrended. You can look at the CO2 series without detrending
it if you see it convenient.
I take the nonresponse as a "no I haven't".What effect does this processing have on phase distortion? The phase
relationship between temp and CO2 is, after all, what you are hanging
your causal hat upon, right?
To answer to all this would plunge us ass-deep into laplace and
z-transforms. May I presume you haven't done that?
Le 25/02/2026 a 22:46, Vincent Maycock a ocrita:
This is data : variation rate of global GISS temperatures and variationAre you sure the Mauna Loa observatory is representative, to begin
rates of carbon dioxide concentration published by the Mauna Loa
observatory. Which curve peaks precede the other curve peaks, the red
one or the green one ?
with at least, of global changes in CO2 levels?
The Mauna Loa observatory was the first set up to record daily carbon >dioxide levels in 1958. A handful of other laboratories exist which
provide local data series, example : Barrows(AK).
On the graph of variation rates of global GISS temperatures and
variation rates of carbon dioxide concentration published by the Mauna
Loa observatory. Which curve peaks precede the other curve peaks, the
red one or the green one ?
https://www.woodfortrees.org/plot/gistemp/derivative/mean:12/mean:14/from:1958/normalise/plot/esrl-co2/derivative/mean:12/mean:14/scale:20/detrend:3/from:1958/normalise
[ ] the red curve
[ ] the green curve
Le 25/02/2026 a 22:47, Vincent Maycock a ocrita:
What if initial anthropogenic warming was too small to show up in the
atmospheric CO2 (perhaps due to the high solubility of CO2 in water
compared to land) levels until it was released into the atmosphere
from the oceans, making it look like temperature was causing the CO2
levels to increase?
It does not "look like", warm temperatures over (tropical) oceans cause >carbon dioxide in emerging deep cold waters (currents) to outgas. >Conversely, over cold oceanic zones, ocean waters absorb carbon dioxide. >Then dissolved carbon dioxide travels for centuries and millenia and >randomly (chaotically) emerges elsewhere. It causes very slow
(centuries, millenia) "global" variations.
On Thu, 26 Feb 2026 08:23:52 +0100, Paul Aubrin
<paul.aubrin@invalid.org> wrote:
Le 25/02/2026 |a 22:46, Vincent Maycock a |-crit-a:
This is data : variation rate of global GISS temperatures and variation >>>> rates of carbon dioxide concentration published by the Mauna LoaAre you sure the Mauna Loa observatory is representative, to begin
observatory. Which curve peaks precede the other curve peaks, the red
one or the green one ?
with at least, of global changes in CO2 levels?
The Mauna Loa observatory was the first set up to record daily carbon
dioxide levels in 1958. A handful of other laboratories exist which
provide local data series, example : Barrows(AK).
And do you have any data for those?
On the graph of variation rates of global GISS temperatures and
variation rates of carbon dioxide concentration published by the Mauna
Loa observatory. Which curve peaks precede the other curve peaks, the
red one or the green one ?
https://www.woodfortrees.org/plot/gistemp/derivative/mean:12/mean:14/from:1958/normalise/plot/esrl-co2/derivative/mean:12/mean:14/scale:20/detrend:3/from:1958/normalise
[ ] the red curve
[ ] the green curve
In this graph of CO2 and temperature vs.time, which follows which, the
yellow dots or the blue line?
https://skepticalscience.com/pics/ShakunFig2a.jpg
It does not "look like", warm temperatures over (tropical) oceans causeDo you agree that CO2 levels can be caused by increases in
carbon dioxide in emerging deep cold waters (currents) to outgas.
Conversely, over cold oceanic zones, ocean waters absorb carbon dioxide.
Then dissolved carbon dioxide travels for centuries and millenia and
randomly (chaotically) emerges elsewhere. It causes very slow
(centuries, millenia) "global" variations.
temperature, and that they can cause increases in temperature as well?
Le 26/02/2026 a 16:49, Vincent Maycock a ocrita:
It does not "look like", warm temperatures over (tropical) oceans causeDo you agree that CO2 levels can be caused by increases in
carbon dioxide in emerging deep cold waters (currents) to outgas.
Conversely, over cold oceanic zones, ocean waters absorb carbon dioxide. >>> Then dissolved carbon dioxide travels for centuries and millenia and
randomly (chaotically) emerges elsewhere. It causes very slow
(centuries, millenia) "global" variations.
temperature, and that they can cause increases in temperature as well?
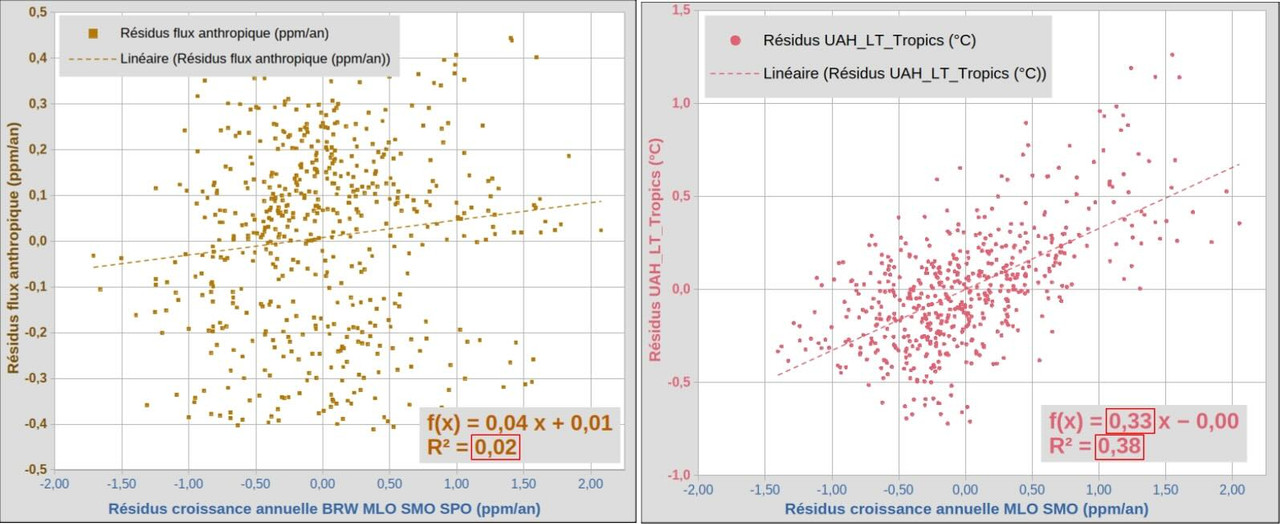
But, overall, over the last 68 years, atmospheric CO2 ppm variations
follow temperature variations by 6 or 7 months.
There are several
feedbacks (clouds for example), the overall feedback is negative
(systems with large positive feedbacks are oscillators).
Le 26/02/2026 a 11:30, Samuel Spade a ocrita:
I take the nonresponse as a "no I haven't".What effect does this processing have on phase distortion? The phase
relationship between temp and CO2 is, after all, what you are hanging
your causal hat upon, right?
To answer to all this would plunge us ass-deep into laplace and
z-transforms. May I presume you haven't done that?
I studied that at the university (signal processing).
An industry
scientist
thought us the double mean trick (and its frequency domain
correspondance). Using the same filter on both series makes an eventual "distortion" the same for the two series.
Actually, the whole thing
compares the desaisonnalized monthly variations of both series.
If you still have a doubt, the wood for trees graphing tool has a
fourrier transform tool. The final result is the same.
But, overall, over the last 68 years, atmospheric CO2 ppm variations
follow temperature variations by 6 or 7 months.
There are several
feedbacks (clouds for example), the overall feedback is negative
(systems with large positive feedbacks are oscillators).
Paul Aubrin<paul.aubrin@invalid.org> wrote:
But, overall, over the last 68 years, atmospheric CO2 ppm variationsYou keep asserting this, but you have yet to provide valid evidence.
follow temperature variations by 6 or 7 months.
studied that at the university (signal processing).Then you should have known better.
I studied that at the university (signal processing).Then you should have known better.
Le 27/02/2026 a 07:48, Samuel Spade a ocrita:
Paul Aubrin<paul.aubrin@invalid.org> wrote:
But, overall, over the last 68 years, atmospheric CO2 ppm variationsYou keep asserting this, but you have yet to provide valid evidence.
follow temperature variations by 6 or 7 months.
The evidence has been shown many times,
he evidence has been shown many times,
All you've shown is arm-waving and the same tired denialist apologetics.
I've debunked your claims, and you can only snip, run, deny, and repeat.
Le 28/02/2026 a 06:57, Samuel Spade a ocrita:
he evidence has been shown many times,
All you've shown is arm-waving and the same tired denialist apologetics.
I show you official data in graphic form.
Paul Aubrin<paul.aubrin@invalid.org> wrote:
Le 28/02/2026 |a 06:57, Samuel Spade a |-crit-a:You showed us purported data that has been massaged by a process you
I show you official data in graphic form.he evidence has been shown many times,All you've shown is arm-waving and the same tired denialist apologetics.
can't explain,
| Sysop: | Amessyroom |
|---|---|
| Location: | Fayetteville, NC |
| Users: | 59 |
| Nodes: | 6 (0 / 6) |
| Uptime: | 18:22:27 |
| Calls: | 810 |
| Calls today: | 1 |
| Files: | 1,287 |
| D/L today: |
10 files (21,017K bytes) |
| Messages: | 193,763 |