From Newsgroup: uk.sci.weather
Large jump in this projection, as El Nino is just about to start,
returning to the value of Feb 2023, only matched by
July 2023 with July and Aug 2024.
For each of these graphical monthly outputs, I do a scale-matched blink comparison for any changes in the earlier data.
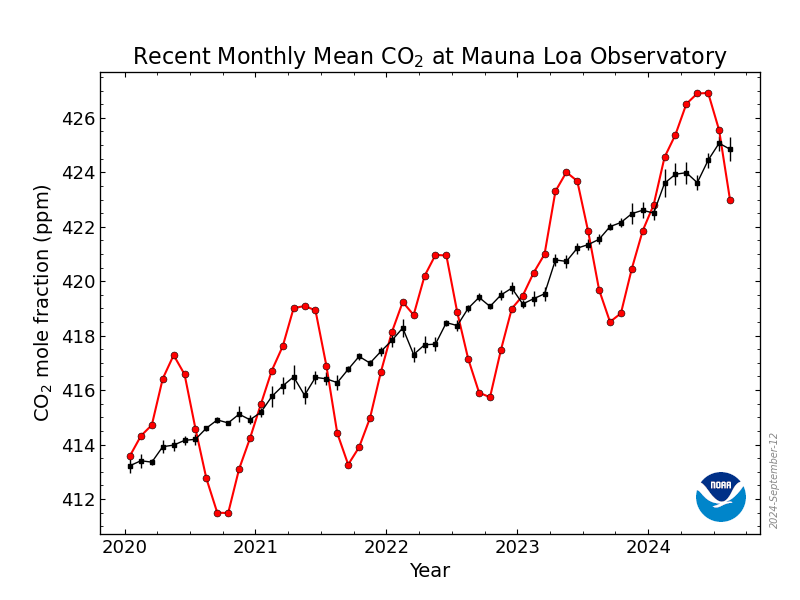
For Mauna Loa data output 05 June 2025 at
https://gml.noaa.gov/webdata/ccgg/trends/co2_trend_mlo.png
and the earlier tabulated data
Using the off-line javascript curve-fitter at statpages.info
Of curve types , linear=no acceleration, exponential=increasing
acceleration, quadratic=fixed acceleration, indicial= falling
acceleration; indicial was best fit by R^2 factor again, but only very marginally over the quadratic and exponential forms.
then adding yearly sine component,
y= a + b*x^c + d*sin(e*x+f)*(1+g*x)
where x is year minus 2000 for data subset start year of 2003 to
avoid the decade of post-Pinatubo geodata recovery, 6
figures retained for anyone else repeating/checking this exercise (bear
in mind the graphical most recent data )
For June 2025 output
a= 371.262643
b= 1.070377
c= 1.219741
d= 3.001688
e= 6.264681
f= 6.411354
g= -0.001925
previous history for the sine form of indicial curve type, ignoring the
annual sine component here
To 2050 ,for Jun 2025 output= 497.690 ppm (+0.39 ppm)
To 2050 ,for May 2025 output= 497.300 ppm ( -0.2 ppm)
For mar and apr outputs, not processed
To 2050 ,for Feb 2025 output= 497.501 ppm ( +0.08 ppm)
To 2050 ,for Jan 2025 output= 497.425 ppm ( +0.19 ppm)
To 2050 ,for Dec 2024 output= 497.239 ppm ( +0.18 ppm)
To 2050 ,for Nov 2024 output= 497.062 ppm ( +0.05 ppm)
To 2050 ,for Oct 2024 output= 497.016 ppm ( -0.03 ppm)
To 2050 ,for Sep 2024 output= 497.046 ppm ( +0.07 ppm)
To 2050 ,for Aug 2024 output= 496.976 ppm ( +0.44 ppm)
To 2050 ,for Jul 2024 output= 496.533 ppm ( +0.51 ppm)
To 2050 ,for Jun 2024 output= 496.020 ppm ( +0.28 ppm)
To 2050 ,for May 2024 output= 495.737 ppm ( +0.09 ppm)
To 2050 ,for Apr 2024 output= 495.646 ppm ( -0.18 ppm)
To 2050 ,for Mar 2024 output= 495.827 ppm ( -0.15 ppm)
To 2050 ,for Feb 2024 output= 495.979 ppm ( -0.24 ppm)
To 2050 ,for Jan 2024 output= 496.222 ppm ( -0.05 ppm)
To 2050, for Dec 2023 output= 496.274ppm (-0.01 )
To 2050, for Nov 2023 output= 496.286ppm (-0.20 )
To 2050, for Oct 2023 output= 496.481ppm (-0.24 )
To 2050, for Sep 2023 output= 496.723ppm (-0.26 but partial data
revisionism )
To 2050, for Aug 2023 output= 496.981ppm (+0.35 )
To 2050, for Jul 2023 output= 496.638ppm (+0.46 )
To 2050, for Jun 2023 output= 496.18 ppm ( +0.27 )
To 2050, for May 2023 output =495.91 ppm (-0.10)
To 2050, for Apr 2023 output =496.01 ppm (-0.80)
To 2050, for Mar 2023 output =496.81 ppm (-0.79)
To 2050, for Feb 2023 output =497.60 ppm (-0.67)
To 2050, for Jan 2023 output =498.27 ppm (-0.28)
To 2050, for Dec 2022 output =498.55 ppm (-0.27)
To 2050, for Nov output =498.82 ppm ( -0.49)
To 2050 ,for Oct output=499.31 ppm (-0.32)
To 2050 ,for Sept output=499.63 ppm (-0.04)
To 2050 , for August output= 499.67 ppm (+0.20)
July 2022 output data , to 2050 , 499.47 ppm (+0.04)
June 2022 output data , to 2050 , 498.43 ppm (+0.15)
May 2022 output To 2050 , 498.28 ppm (-0.39)
April output to 2050, 498.67 ppm (-0.83)
March output to 2050, 499.5 ppm (-0.20)
Feb output was 499.7 (-15.55)
Jan 2022 output was 515.25
--
Global sea level rise to 2100 from curve-fitted existing altimetry data <
http://diverse.4mg.com/slr.htm>
--- Synchronet 3.21a-Linux NewsLink 1.2